

- Client :
- Category :Discrete Events
- Project Url :
- Date :February 4, 2025
The Challenge
The project involved analyzing the transport operations of a single-track railway corridor used for bulk material transportation. The railway operates with a centralized control system and includes multiple passing loops to allow trains traveling in opposite directions to operate efficiently.
Each train consists of a set number of wagons carrying thousands of tons of material. The corridor at the time of the project handled several loaded trains per day, with a full cycle time of over two days. The objective was to assess the railway’s capacity to accommodate additional trains while ensuring smooth operations and avoiding collisions. Accordingly, the main challenge was increasing throughput while maintaining safe and efficient train movements. Given the constraints of a single-track system, delays at passing loops, and limited data on the existing movement control mechanisms, a simulation approach was required to explore different operational strategies.
The Solution
A simulation model was developed using AnyLogic’s Rail Library and Process Modeling Library to replicate real-world railway operations.
Railway Layout & Track Infrastructure
The information available regarding the rail layout was only the geolocations of points along the rail and the loops. To prepare the rail layout in AnyLogic, the GPS points were used to prepare a shape file using Python. The file is then imported to AnyLogic and converted into a railyard.
Train Movement
The rail library in AnyLogic detects collisions, however it is the responsibility of the modeler to build the process to avoid these collisions. During its trajectory, each train moves through a rail network that consists of a unique train track with several loops. These loops allow for the trains to wait for trains coming in the opposite direction, so they can avoid crashes. Safety being of high consideration, it is important to have a collision avoidance algorithm that will avoid collisions with 100% certainty. The algorithm translates to the decision, at the arrival to a loop, for a train to either continue its way towards the destination or take the loop and wait for the next track section to be safe.
In the real world, the algorithm that determines what a train should do when arriving at a loop is not accessible to us, and for that reason we needed to create our own. We created a simplified algorithm that behaves as a pseudo-optimal solution, that is good enough to understand the system and find the number of trains that should be at work to maximize throughput.
In addition to the above, several factors were taken into consideration in the process, such as, trains length, trains average speed in each direction, loading and unloading times of the materials at the ends of the rail, the capacity at the rail ends which is the maximum number of trains that can be waiting at the same time to enter the rail, and train failure incidents which occurred in the model according to a custom distribution prepared from real data.
Visualization
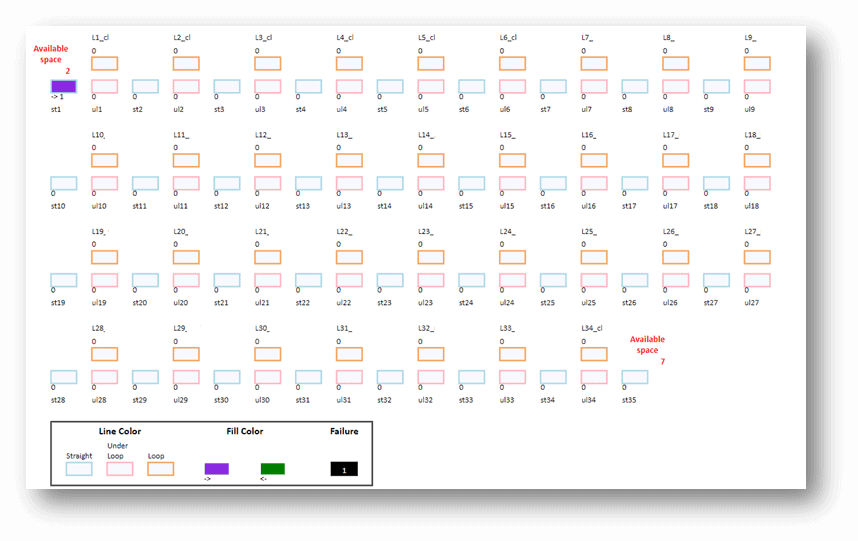
Since the rail is very long and is difficult to visualize with an appropriate scale during model run, we devised a visualization scheme that helps to easily identify trains’ movement along the rail and was essential for model validation. The figure below shows a sample of the scheme as well as the relevant legend.
Results
The simulation provided key insights into the trade-offs between cycle time, congestion, and overall throughput. The information extracted from the simulation model was used to produce several graphs using python to analyze the results. The main findings included:
Optimal Train Count:
The system could support a significantly higher number of trains per day without collisions.
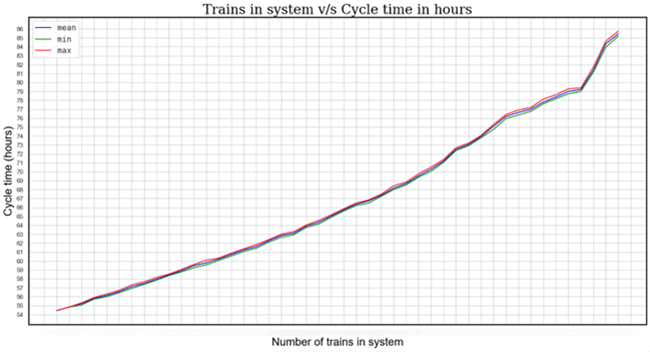
The following graph shows how the mean cycle time increases as more trains are used in the system, finding a collapse after n trains are reached in which a rough increase in the slope is noticed.
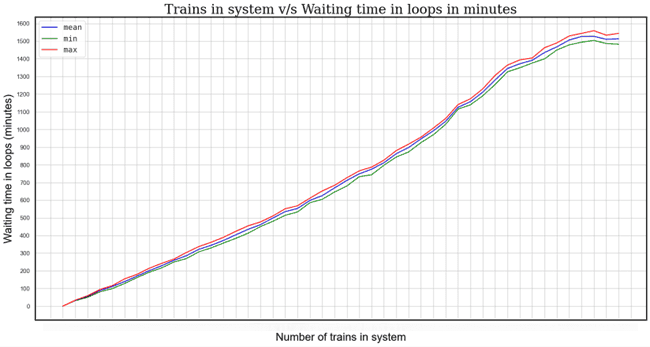
The same can be observed when looking at the mean waiting times in loops as more trains are added into the system. With multiple simulation runs, the values don’t change significantly.
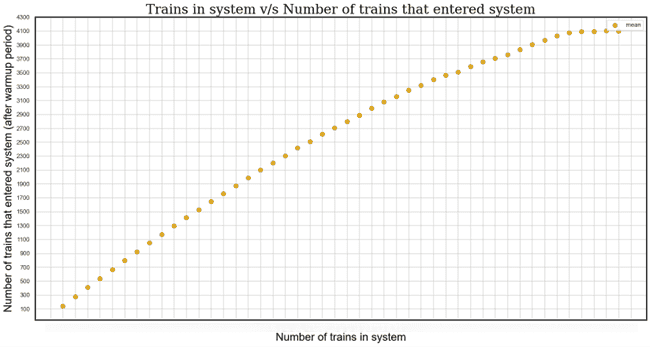
The following graph shows the total number of loaded trains that entered the system (equivalent to the throughput) during the simulation duration. The same trend of increase as in the previous graphs is noticed in the number of entering trains as more trains are added into the system. Beyond n trains, it is not worth adding more trains.
Bottleneck Identification
The primary limiting factor was the available space for unloading, highlighting areas for potential operational improvements.
We can see from the next graph that at n trains, the number of trains at the unloading side reaches its limit, which indicates that this side might be a bottleneck to the ability of the system to improve its throughput.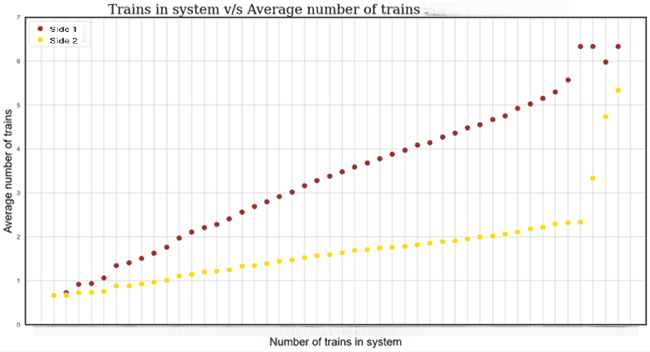
The railway operator gained valuable data-driven recommendations for improving infrastructure planning and throughput optimization. The findings provided a foundation for future enhancements, including refining dispatch algorithms and optimizing facility operations.