
- Client :S. Witt
- Category :System Dynamics
- Project Url :
- Date :June 3, 2019
Challenge
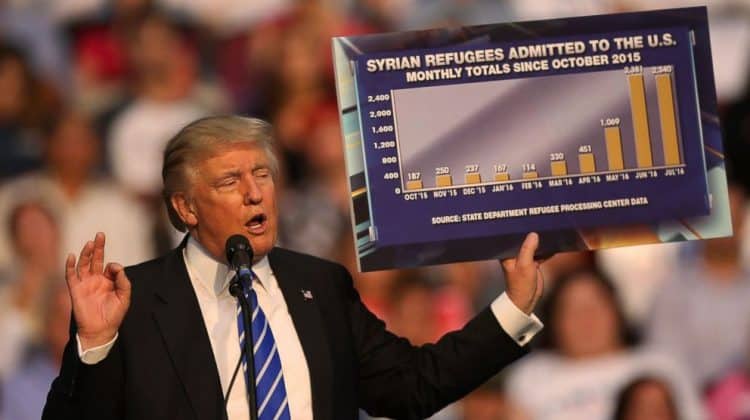
After Trump’s election in the United States in 2016, an immigration ban on different Muslim countries was conducted. This ban was predicted to have several social implications, in particular in terrorism. The purpose of this project is to understand the impact of Trump’s policy banning 6 countries from the Middle East and Africa on terrorism actions executed in the US. To achieve this, a model was needed in order to understand on a macro perspective the impact of a policy that, while reducing the number of potential terrorists by reducing population and tightening immigration policies, also generates hate, which is one of the main drivers for terrorist actions.
This is a very complicated social topic, but very well documented with several scientific papers, books and articles associated to the topic. The challenge was to use this available information in order to understand causalities and be able to measure at least qualitatively if terrorism attacks would increase, decrease or remain the same.
Solution
Based on the existent documentation on the topic, the first step was to understand the main causalities leading to an increase in terrorism. For that purpose, a Causal Loop Diagram (CLD) was created showing the main drivers and feedback loops associated with terrorism (figure 1).
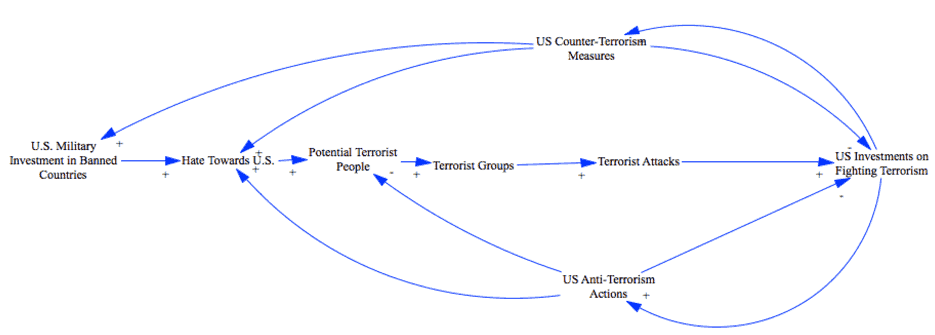
Figure 1 – Terrorism Attacks CLD
This CLD is a simplification of the complexity related to this topic. But it takes the most important factors into consideration condensed in few variables. For instance extremist ideologies, repression, external actors, charismatic ideological leaders are all summarized in the variable “hate towards U.S.”, which tells us that a more detailed model can be generated if needed if we want to know for instance what variables cause most of the terrorist attacks, which was not the purpose of this study in particular.
The variable that we want to measure is the number of attacks per year in the US. To validate the model, the model has to be able to roughly replicate what the data is telling us. The variables of the model are adjusted in such a way that the model makes sense in relation to this data. The yearly attacks data was taken from the Global Terrorism Database (GTD) and it looks like this: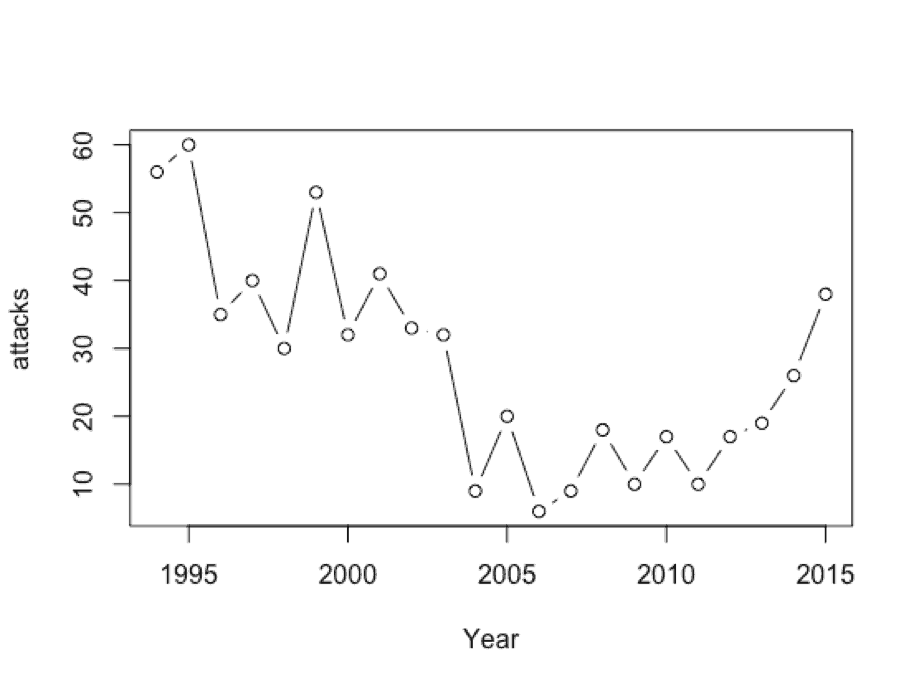 Figure 2 – Yearly attacks in the US
Figure 3 shows the expected attacks shown by the model. The model shows that the attacks tend to stabilize in the future on around 37 attacks per year, which is roughly the same data we get from the Global Terrorism Database (GTD) in 2015. These attacks may be successful or not, so they can be defined as terrorist attack attempts. An assumption we make here is that we have reached the peak of technology for terrorists to recruit and deploy information about their ideologies. This is done by the use of private browsers such as Tor, and secure instant messaging Software as Telegram. If the assumption is not true, we should continue seeing a small growth in attacks in the next few years. This doesn’t matter for our end goal, which is to understand if there is a reduction in attacks from Trump’s policy, which would be the same in both cases.
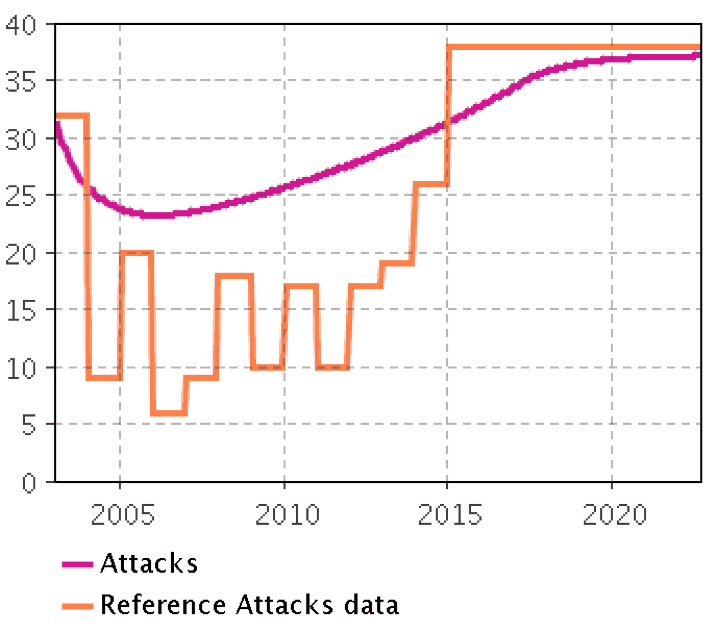
Figure 3 – Attacks reference outcome of the model
Outcome
The results of the model showed a 2% to 4% reduction of attack attempts in the US with Trump’s policy in place, which sounds at first sight like a reasonable reduction, giving credit to the policy itself. From the GTD data, we can see that since 2003, the percentage of successful attacks is 80%. So the number of attacks that would be successful that would be stopped by Trump’s policy in the next 5 years would be of around six at most, and these attacks don’t necessarily have fatalities. Is this worth it in exchange for all the social, political and economical stress?
Project Features
- Industry: Government
- Model: System Dynamics
- Duration: 1 Month