
- Client :ADS LLC
- Category :Agent-Based, Optimization, Parameter Variation
- Project Url :N/A
- Date :October 22, 2018
Optimization for Sensor Locations to Detect Sewer Overflows
Challenge
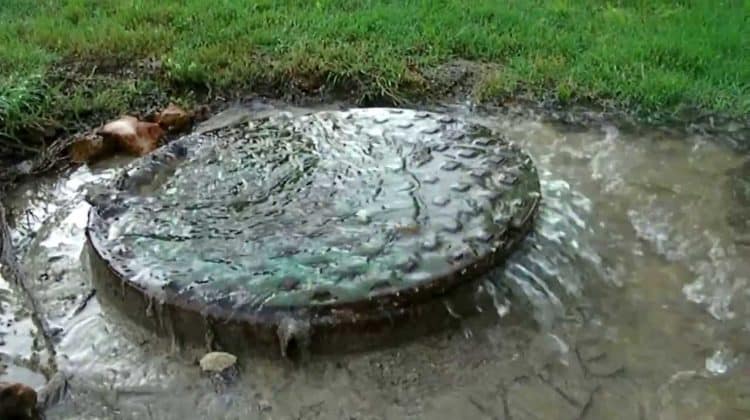
The purpose of the project was to validate a technique to select monitoring locations and times that best reduce the probability and consequences of sewage overflows.
In physical terms, the problem represents movement of ultrasonic level monitors through discrete locations in a sewer network. The monitors move in both a distance and direction in accordance with rules established by a search algorithm.
As the monitors move, they will change their state, which is defined by a “Risk Priority Number” (RPN). The monitors act individually but it is their collective RPN that needs to be optimized. The goal is for the monitors to seek “hot spots” in the environment where the RPN is highest. RPNs are known to cluster within the environment as illustrated in figure 1. The deepest purple color codes indicate the highest clusters of RPN. Red line segments are a redundant indication of high RPN.

Figure 1: Hotspot clusters
The main objective of the project was to generate a tool using AnyLogic to parameterize the problem and to have an easy and clean method to develop the best optimization algorithm.
Solution
The data was imported from GIS files, and cleaned using R. The cleaned data was exported to an Excel file to be used by AnyLogic directly. Using R in this case was easier and faster than processing the data using the ShapeFile and JAVA directly in AnyLogic. It is generally a good idea to process the data before using it in AnyLogic.
As previously stated, the monitors can move in different ways depending on the optimization algorithm chosen, and the idea was to enhance the simulated annealing algorithm and compared it to three others:
- The basic version of simulated annealing algorithm
- The greedy algorithm
- The sequential search
Figure 2 shows the main visualization of the simulation model, where the map shows the manholes with the different characteristics of the search parameters (monitors, hotspots, manholes and search reach) and graphs on the evolution of the objective function from iteration to iteration. The map was generated using Euclidean coordinates since the shapefile provided by the client didn’t have the geolocation of the manholes, but instead had a transformation to Euclidian space. For that reason GIS functionalities were not used in AnyLogic and were not necessary.
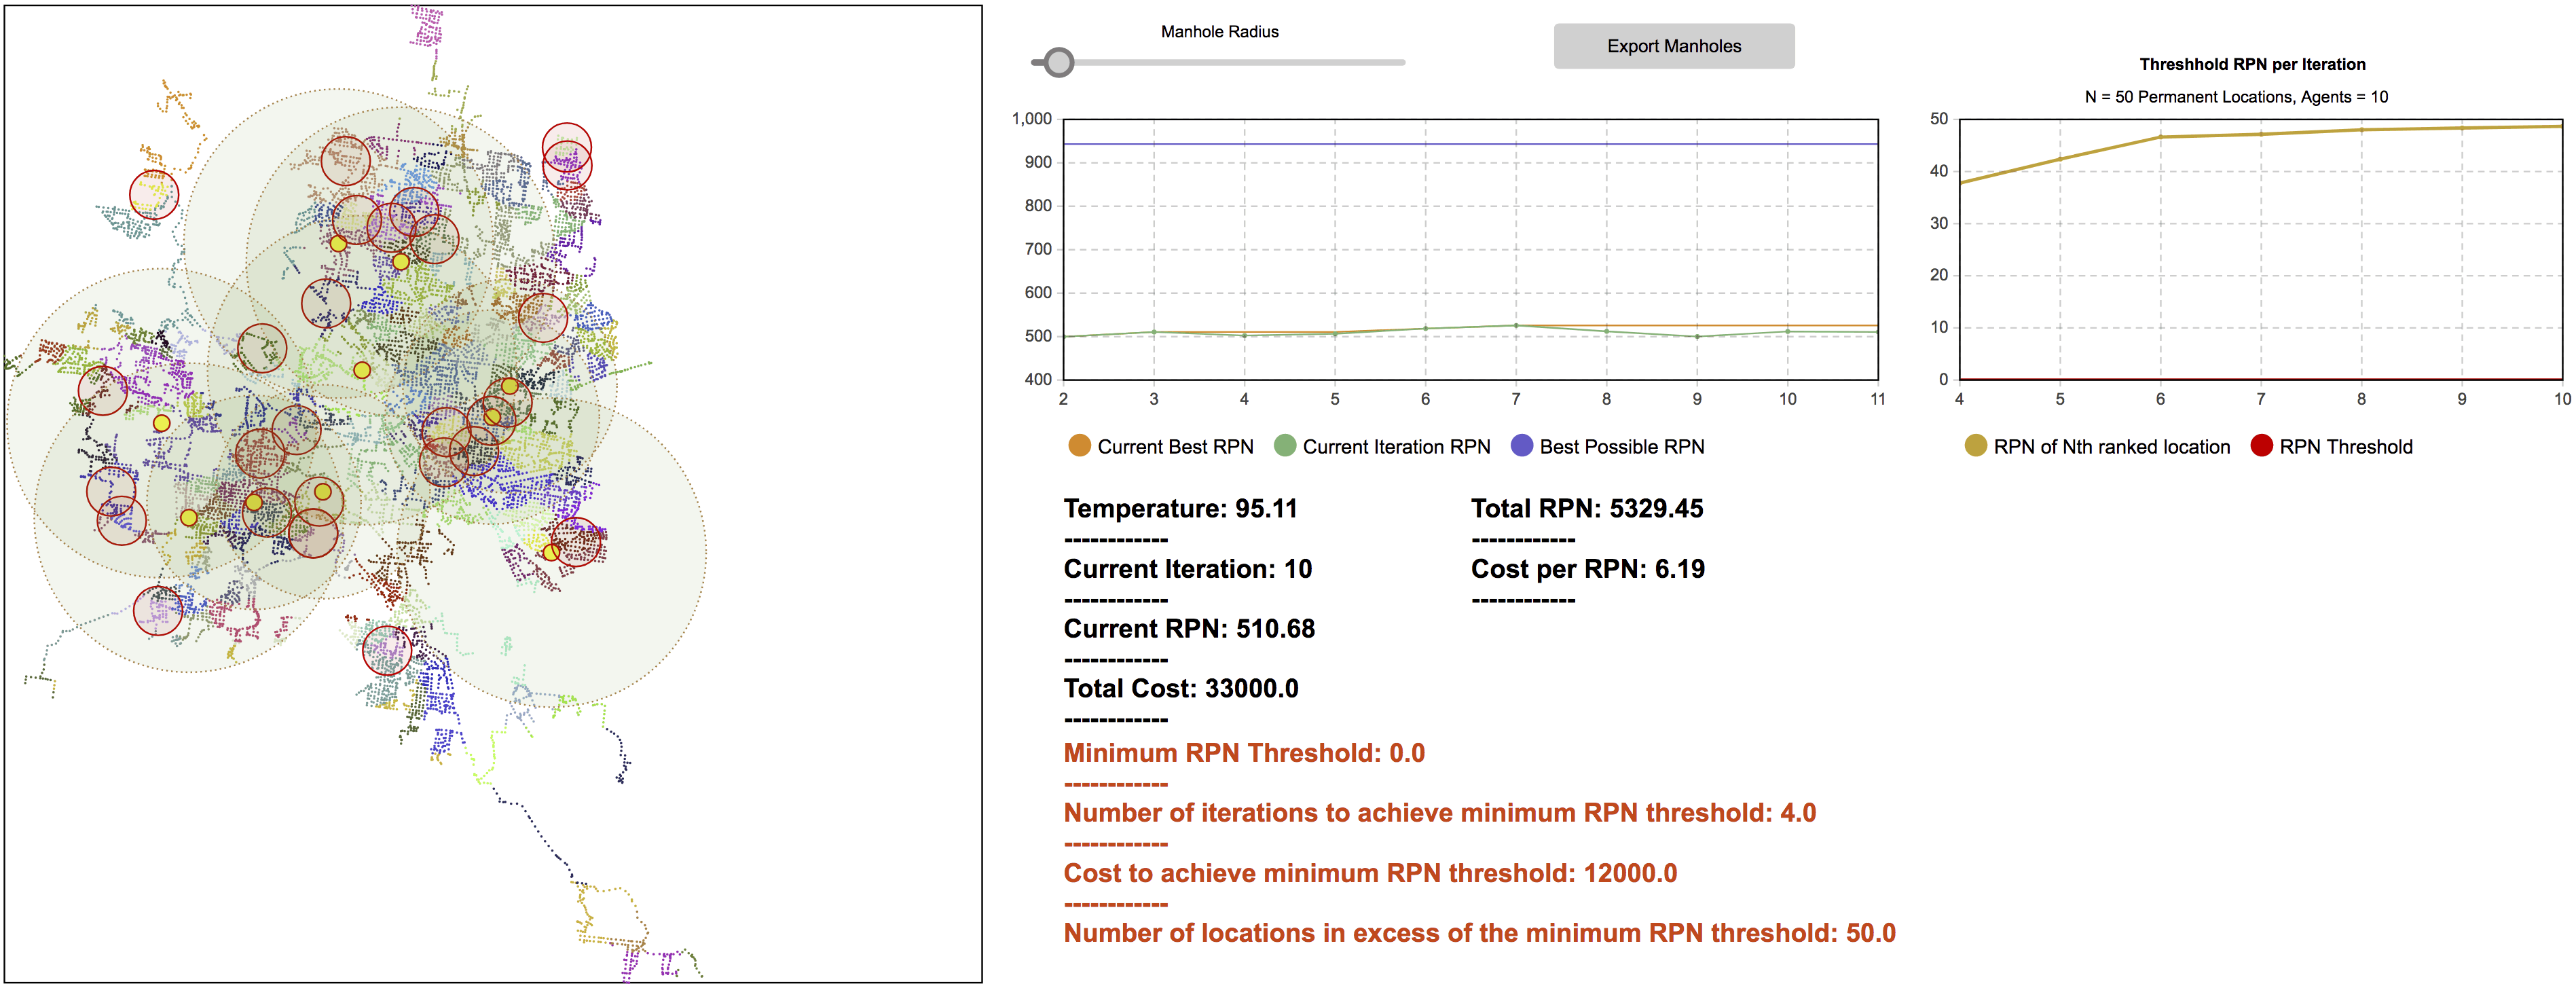
Figure 2 – Visualization of the simulation model
In this particular project, the client was very participative and interested in doing most of the analysis himself so the focus was mainly oriented into developing within the simulation model, tools to help the client perform those analyses. For that reason, the client learned how to use the Simulation model thoroughly in order to perform the necessary tasks using excel exports functionalities, graphical elements and log helpers. We then worked together in order to improve the enhanced simulated annealing algorithm.
Outcome
The model was very useful for the client to understand different characteristics of the system and the use of diverse parameters necessary to generate hotspots and to initialize the position of monitors in the real world. It was also very insightful for the client to find a way to improve the algorithm by testing a number of parameter combinations and small adjustments to enhance the simulated annealing algorithm. We worked step-by-step making small changes progressively until we found a good solution that fulfilled the initial needs.
Project Features
- Industry: Wastewater
- Model: Agent-Based
- Duration: 11 months