
- Client :Guy V.
- Category :Discrete Events, Pedestrian
- Project Url :N/A
- Date :October 29, 2018
People Flow in an Office
Challenge
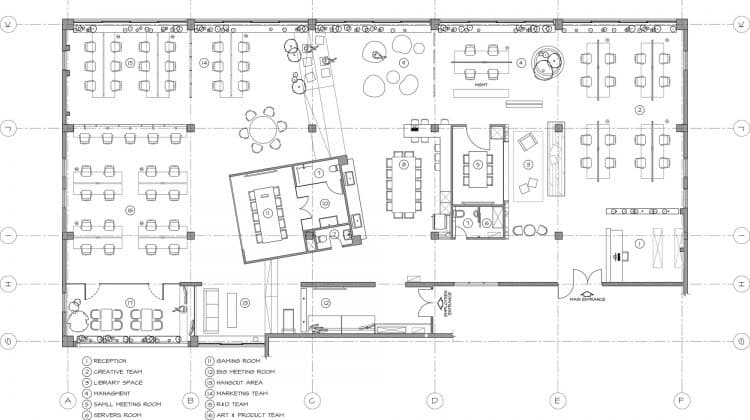
The challenge of this project was to quickly create a proof of concept simulation of people working and interacting in an office. The objective was to understand which areas of the office yield more traffic, and which areas are less visited. The activities that needed to be captured in the model were:
- Working in their desks, library, hangout area, gathering space and balcony
- Using the restrooms
- Attending meetings
- Eating Lunch
- Using the coffee area and the kitchen
Solution
To build this model, the pedestrian library of AnyLogic was used in combination with the process modeling library. This model was created quickly in less than one day, which shows that a simple proof of concept can be built extremely fast making assumptions that are clearly communicated to the client. Since this office didn’t exist and no data was available, I generated the assumptions on my own. The objective was to have a general idea of the density map throughout a work day, so the assumptions were conservative. The client also needed a solution quite quickly so a decision to simplify the model in general and to avoid wasting time looking for inexistent data was taken.
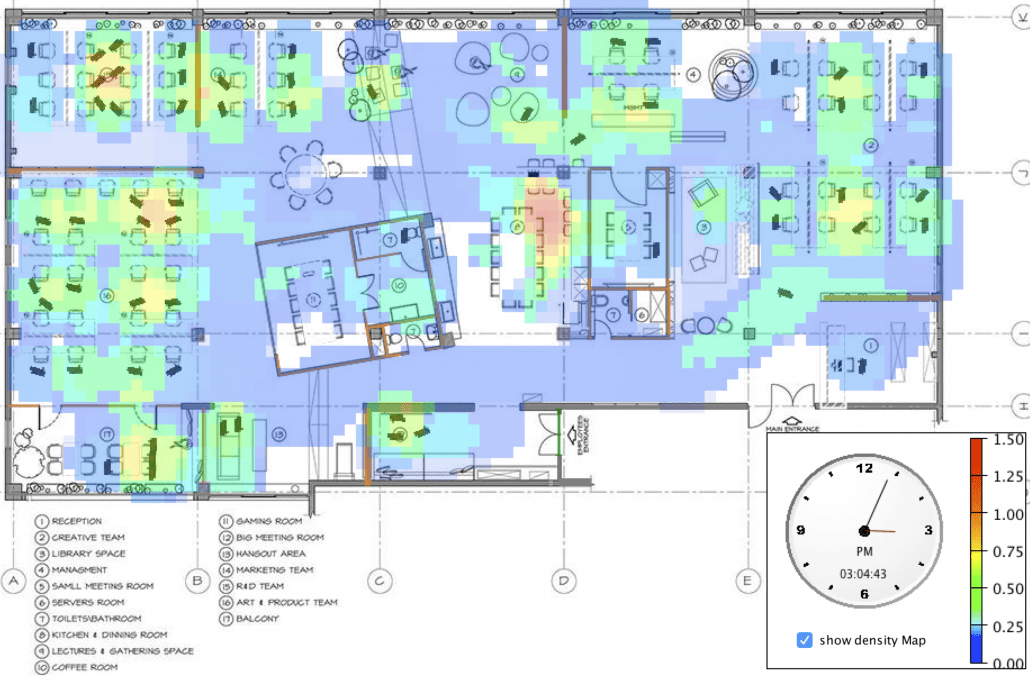
Figure 1 – Density Map in The Office
Outcome
The client needed this proof of concept as part of a proposal to design an office layout. The output of the project was a video where the office population could be easily seen in order to more easily distribute the file to different stakeholders that may have difficulties using AnyLogic or have problems executing standalone applications. The video was presented as part of the full proposal. Even though the simulation was not the protagonist this time, it was used as an additional data point to support the office layout design.
Project Features
- Industry: Office
- Model: Discrete-Events, Pedestrians
- Duration: 1 day