

- Client :Coltrane
- Category :Agent-Based, Discrete Events
- Project Url :
- Date :June 14, 2019
Challenge
This is one of the small projects that come up once in a while. The objective was to build a dashboard which controls a simulation that displays visually the process of speed dating in a facility with a certain amount of tables and a certain inflow of people wanting to participate in this very well known dating technique. The idea was to understand the behavior of the system with a particular table setting and 1-1 dating strategies in order to improve the experience of the customers.
Solution
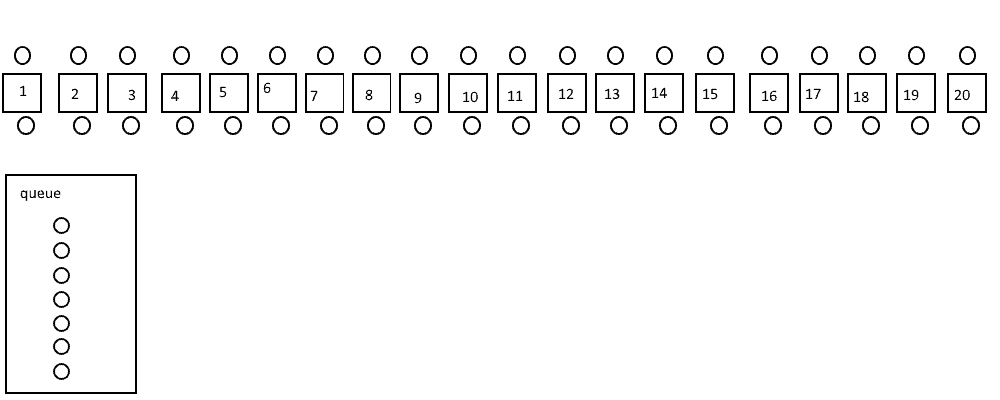
The solution was built as a simulation in AnyLogic using a hybrid with Discrete-Events and Agent-Based. The client’s objective was to collect data only, and the visualization as a bird view with lemmings style. The simulation was based on the following figure that represents the tables where 1-1 dates are being held:
Outcome
The outcome of this project was an easy to use Software to test different scenarios, save scenarios, load scenarios etc in order to collect data on this dating room. The rest of the analysis was made by the client having the option of exporting the necessary data to Excel for further investigation.
Project Features
- Industry: Entertainment
- Model: Discrete-Events, Agent-Based
- Duration: 2 weeks